
Hunger saw a dramatic rise in the greater Washington region over the last year.
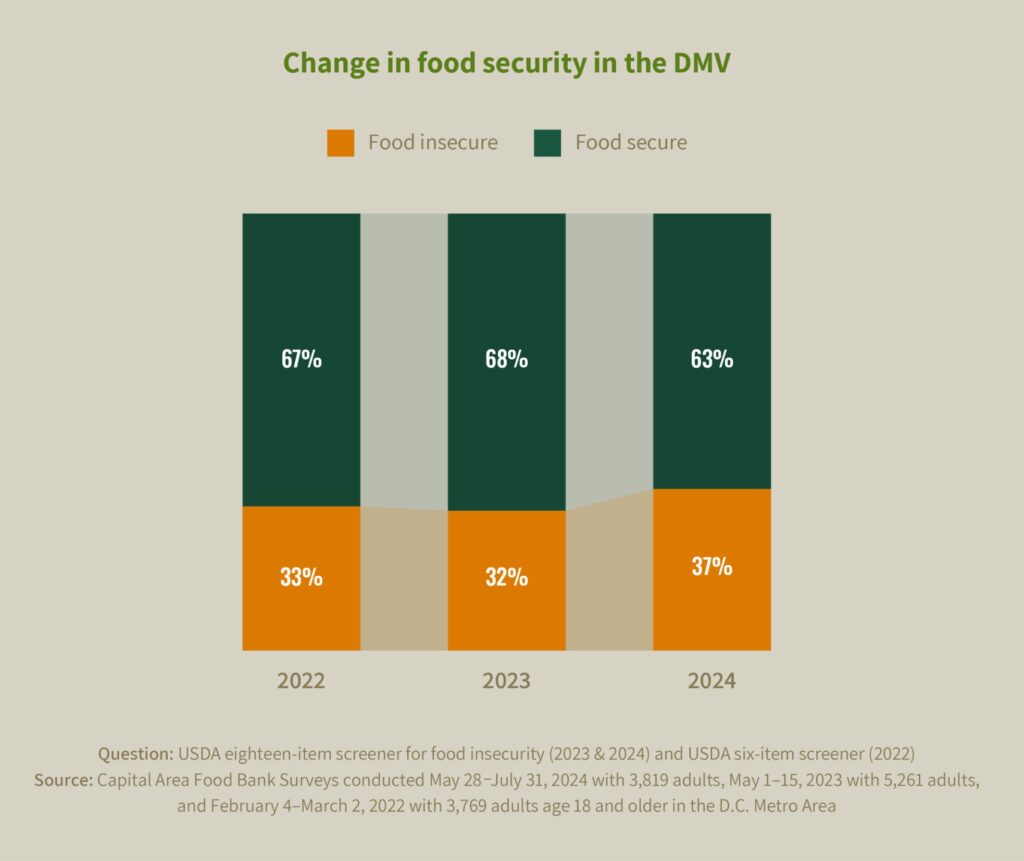
Across the DMV, a startling 37% of households did not know where their next meal was coming from at some point between May 2023 and May 2024, according to data in our new Hunger Report. That’s an increase of 5 percentage points from last year’s report, when 32% of households in the region experienced food insecurity during the prior year.
It’s also the highest level of regional food insecurity seen since CAFB began working with the highly trusted independent social research organization NORC at the University of Chicago in 2022 to gather data for the report via a general population survey. Looking across the region, that level of prevalence means nearly 1.5 million people struggled to access enough food.
The only study of its kind, Hunger Report 2024 makes profoundly clear that beyond the many positive economic headlines of the last year, there are enormous numbers of our neighbors experiencing a different reality. The report illuminates the multiple, often compounding forces that continue to make putting food on the table extremely difficult for neighbors across the region.
Higher rates of food insecurity were reported across virtually every category of geography, income and race, when compared to the prior year. People of color, families with children, and those with lower incomes and levels of educational attainment continue to be experiencing food insecurity at disproportionate rates. However, this year’s data also depicted a food-insecure population that is growing increasingly educated and more middle-class, with large spikes seen in food insecurity among middle-income households.
The report’s findings are the result of a general population survey of 3,800 residents, conducted in partnership with the highly trusted independent social research organization NORC at the University of Chicago. It provides a detailed look at who is experiencing food insecurity in the Greater Washington region, the tradeoffs that too many of our neighbors are forced to make between food and other necessities like housing and healthcare, and recommendations that ever sector can take to address these challenges in both the short and longer term.
REPORT IN BRIEF
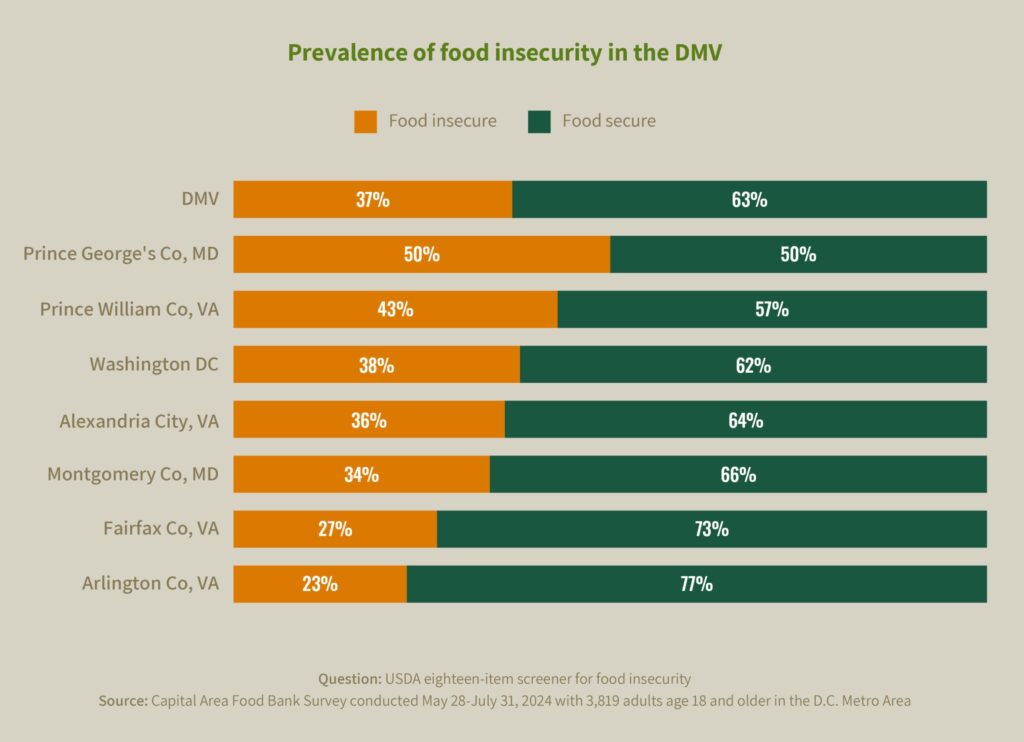
Many people might be surprised to see higher rates of food insecurity across our region after a year of relatively positive economic news. But in every county, more households experienced hunger over that 12-month period. Those county-level rates ranged from 23% in Arlington, Va., to 50% in Prince George’s County.
Changing demographics of those facing food insecurity
What does food insecurity look like across the region? Here’s a snapshot:
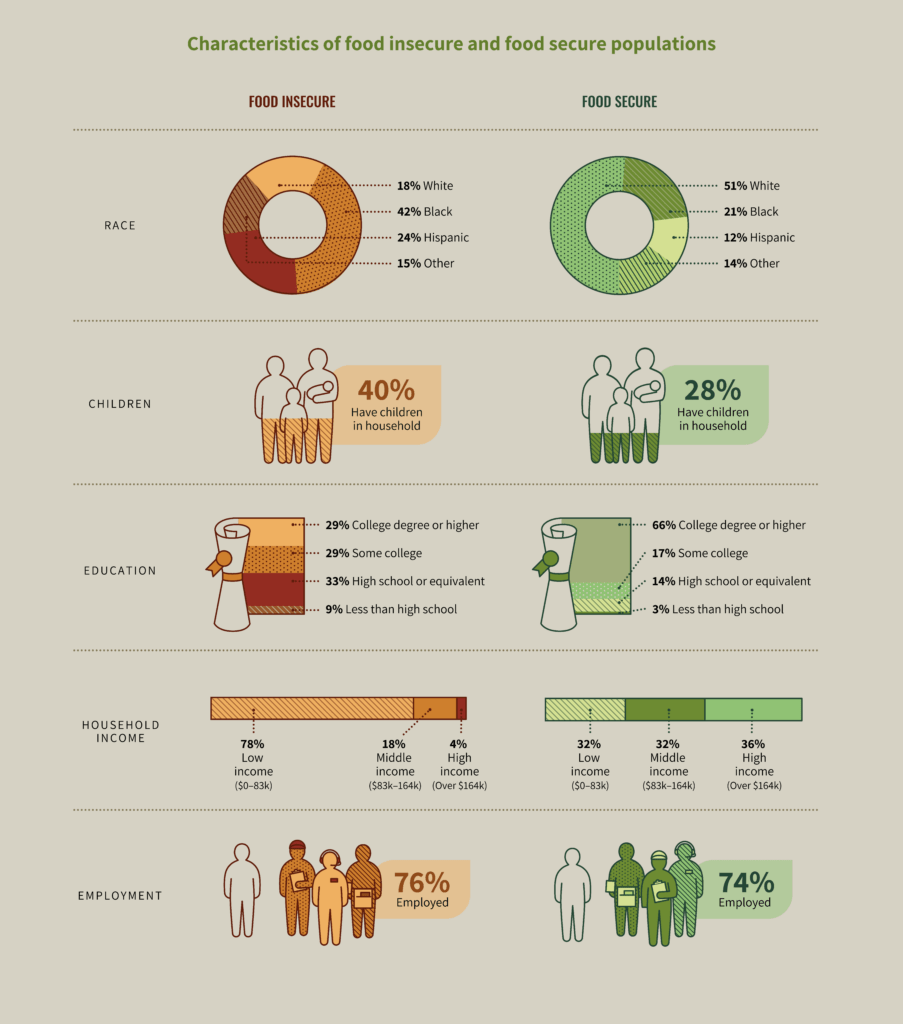
- People of color remain two to three times more likely to be food insecure than white people in our region.
- Every income bracket saw increases in food insecurity, but the largest increases were among households earning $100k-$150k a year.
- A college degree is not enough to prevent food insecurity in this region: well over of half of the food-insecure population holds a college degree or attended some college courses.
- 76% of those who are food insecure are employed. Having multiple jobs may not be enough to make ends meet: Among those who are working, 20% have more than one job — compared to 7% of those who are food secure.
- Food-insecure households are more likely to have children living in them: 40% have children, compared to just 28% of food secure households.
The rate of food insecurity among children tends to be lower than the general household rate, due to adults skipping meals or taking other steps to prioritize food for their children. But the prevalence of food insecurity among children remains significant: 10% of children are food insecure, equating to 103,000 children across the region.
Key forces behind the increase in food insecurity
Most food-insecure respondents reported that their household’s financial situation has gotten worse since last year, making it more difficult to afford essentials like food.
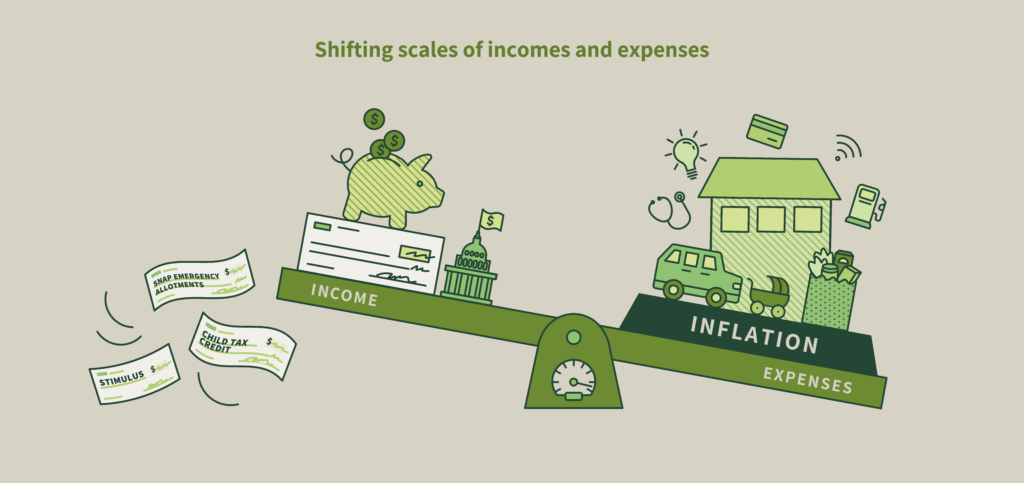
A combination of forces is driving those financial challenges, including inflation, ongoing employment hardships, and the reduced levels of government benefits.
As the cost of living has continued to climb during the last four years, wages have lagged behind and government benefits were temporarily boosted but later reverted to lower levels of support. Employment hardships have lingered or increased across sectors, with loss of hours, wage cuts, and layoffs still relatively common. And after March 2023, when emergency allotments for the Supplemental Nutrition Assistance Program ended, many households were left fully exposed to the effects of inflation with less income – both earned and supplemental.
Among people who said their household finances had worsened over the last year, 20% of people overall, and 32% of people with children, cited a loss or reduction of federal benefits as a major reason.
When it comes to inflation’s effects, 66% of residents reported that higher costs for food have had a major impact on their finances, up from 52% last year. Among food-insecure individuals, 88% of people cited higher food prices as having a major financial impact.
Higher costs beyond food also have strained budgets, making it more difficult to afford enough nutritious food. Nearly half of respondents – 46% – said higher housing costs had a major impact on their household budget. Those higher costs were felt most acutely among those struggling with food insecurity: 69% of those experiencing food insecurity cited housing costs as having a major impact on their budget, compared to 32% of the food-secure population.
Trade-offs between food and other necessities
Food is frequently one of the first areas where people trim back in order to make ends meet. In this year’s survey, 46% of the region’s residents reported running short of money and trying to make their food budget stretch, describing a range of coping strategies for trying to bridge this gap in their budget:
- 61% of people reported eating less than they felt they should because there wasn’t enough money for food. Perhaps most concerningly, 34% of people reported not eating for a whole day due to a lack of funds for food, and 29% of people reported losing weight for this reason.
- 41% of people described having enough to eat, but not of the types of food they wanted to eat when it came to quality, nutrition or a combination of factors.
- 29% shared they sometimes couldn’t provide a balanced meal for their children.
- 18% reported that their children weren’t eating enough because there wasn’t adequate money.
The report also found that the average food-insecure household with children is spending far less in a typical month on food than what experts say is needed to purchase enough food for their household.
Factoring the costs of covering a family’s basic needs where they live, experts from the Economic Policy Institute, MIT, and United Way have each calculated the minimum income that families of various sizes need to make ends meet in different geographies. They suggest that a typical family of four would need a minimum monthly food budget of $1,271, but food-insecure respondents were spending less than half of that amount — only $649 per month – on food between their government benefits ($218) and their own earned income ($431).
While charitable food providers are stepping in to fill in a portion of that gap, 54% of those who are food-insecure said they did not access assistance from the charitable food network. That gap can lead to poorer health and nutrition for thousands of families.
Recommendations to address the rise in hunger
Addressing food insecurity and its key drivers will require a range of strategies across the public, private and non-profit sector, including:
- Maintain and strengthen federal programs that support food security: Federal nutrition programs like SNAP, The Emergency Food Assistance Program (TEFAP) and Commodity Supplemental Food Program (CSFP) play a front-line role in ensuring that people facing hunger get the nourishment they need.
- Adopt state-level policies that expand food access: State-level nutrition programs can build upon federal assistance through additional funding and flexibility to reach more people. These critical programs include universal school meals, “Food is Medicine” programs that can support better health outcomes, and programs that make nutritious food from local farmers and producers more accessible to those in need.
- Support programs and policies that address economic hardship holistically: Moving the needle on food insecurity will ultimately require that lawmakers create policies that more holistically address the multiple other factors impacting the overall economic stability of households in our region, such as access to affordable housing and childcare, and tax credits that can boost income.
- Invest in upskilling the food insecure population: Collaboration between employers, workforce development, and social sector can ensure adult learners have the support needed to complete the training needed to pursue higher-paying jobs. Such programs benefit both those receiving training and the regional employers who need additional skilled workers to fill in gaps in the labor market.
- Increase the accessibility of the emergency food assistance network: the proportion of food insecure people not availing themselves of support has increased from 46% to 56%, potentially due in part to the growth in food insecurity among households in higher income brackets. Strategies for increasing accessibility of that network include raising awareness of food resources, adjusting operating hours to increase convenience, and reducing stigma through service models that are culturally familiar and limiting data collection.